
Wildlife and Landscape Science
Type of resources
Topics
Keywords
Contact for the resource
Provided by
Years
Formats
Representation types
Update frequencies
status
-
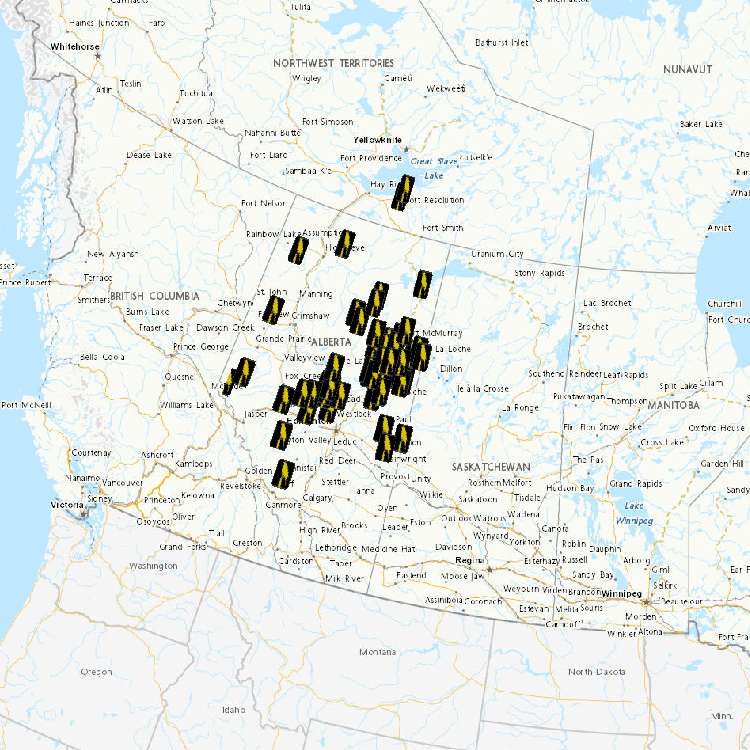
As part of a scientific assessment of critical habitat for boreal woodland caribou (Environment Canada 2011, see full reference in accompanying documentation), Environment Canada's Landscape Science and Technology Division was tasked with providing detailed anthropogenic disturbance mapping, across known caribou ranges, as of 2015. This data comprises a 5-year update to the mapping of 2008-2010 disturbances, and allows researchers to better understand the attributes that have a known effect on caribou population persistence. The original disturbance mapping was based on 30-metre resolution Landsat-5 imagery from 2008 -2010. The mapping process used in 2010 was repeated using 2015 Landsat imagery to create a nationally consistent, reliable and repeatable geospatial dataset that followed a common methodology. The methods developed were focused on mapping disturbances at a specific point of time, and were not designed to identify the age of disturbances, which can be of particular interest for disturbances that can be considered non-permanent, for example cutblocks. The resultant datasets were used for a caribou resource selection function (habitat modeling) and to assess overall disturbance levels on each caribou ranges. Anthropogenic disturbances within 51 caribou ranges across Canada were mapped. The ranges were defined by individual provinces and territories across Canada. Disturbances were remapped across these ranges using 2015 Landsat-8 satellite imagery to provide the most up-to-date data possible. As with the 2010 mapping project, anthropogenic disturbance was defined as any human-caused disturbance to the natural landscape that could be visually identified from Landsat imagery with 30-metre multi-band imagery at a viewing scale of 1:50,000. A minimum mapping unit MMU of 2 ha (approximately 22 contiguous 30-metre pixels) was selected. Each disturbance feature type was represented in the database by a line or polygon depending on their geometric description. Polygonal disturbances included: cutblocks, mines, reservoirs, built-up areas, well sites, agriculture, oil and gas facilities, as well as unknown features. Linear disturbances included: roads, railways, powerlines, seismic exploration lines, pipelines, dams, air strips, as well as unknown features. For each type of anthropogenic disturbance, a clear description was established (see Appendix 7.2 of the science assessment) to maintain consistency in identifying the various disturbances in the imagery by the different interpreters. Features were only digitized if they were visible in the Landsat imagery at the prescribed viewing scale. A 2nd interpreter quality-control phase was carried out to ensure high quality, complete and consistent data collection. For this 2015 update an additional, separate higher-resolution database was created by repeating the process using 15-metre panchromatic imagery. For the 30-metre database only, the line and poly data were buffered by a 500-metre radius, representing their extended zone of impact upon boreal caribou herds. Additionally, forest fire polygons were merged into the anthropogenic footprint in order to create an overall disturbance footprint. These buffered datasets were used in the calculation of range disturbance levels and for integrated risk assessment analysis.
-
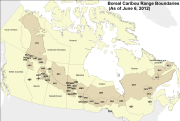
As part of a scientific assessment of critical habitat for boreal woodland caribou (Environment Canada 2011, see full reference in accompanying documentation), Environment Canada's Landscape Science and Technology Division was tasked with providing detailed anthropogenic disturbance mapping across known caribou ranges. This data allowed researchers to better understand the attributes that have a known effect on caribou population persistence. The mapping process was established to create a nationally consistent, reliable and repeatable geospatial dataset that followed a common methodology. The methods developed were focused on mapping disturbances at a specific point of time, and were not designed to identify the age of disturbances, which can be of particular interest for disturbances that can be considered non-permanent, for example cutblocks. The resultant datasets were used for caribou resource selection function,habitat modeling, and assess overall disturbance levels on each caribou ranges. Anthropogenic disturbances within 57 caribou ranges across Canada were mapped. The ranges were defined by individual Provinces and Territories across Canada. Disturbances were mapped across these ranges using 2008-2010 Landsat-5 satellite imagery to provide the most up to date data possible. Originally some areas were mapped to match the date of collected caribou demographic data, however more recent imagery was used and additional disturbance features that were seen since the original mapping date were added. Within the context of this project, anthropogenic disturbance was defined as any human-caused disturbance to the natural landscape that could be visually identified from Landsat imagery at a viewing scale of 1:50,000. A minimum mapping unit (MMU) of 2 ha or approximately 22 contiguous Landsat pixels was selected. Each disturbance feature type was represented in the database by a line or polygon depending on their geometric description. Polygonal disturbances included: cutblocks, mines, reservoirs, built-up areas, well sites, agriculture, oil and gas facilities, as well as unknown features. Linear disturbances included: roads, railways, powerlines, seismic exploration lines, pipelines, dams, air strips, as well as unknown features. For each anthropogenic feature type, a clear description was established (see Appendix 7.2 of the science assessment) to maintain consistency in identifying the various disturbances in the imagery by the different interpreters. Various ancillary vector datasets were used as aids in detecting, classifying and digitizing disturbances on the Landsat imagery (a table listing these datasets and their sources has been included in a separate file). Ancillary data was used to guide interpretation and feature labelling since the ancillary data was often variable across the country in terms of completeness as well as scale. As a result, features were only digitized if they were visible in the Landsat imagery at a viewing scale of 1:50,000. A 2nd interpreter quality control phase was carried out to ensure high quality, completete and consistent data collection. A quality assessment analysis, since an actual accuracy assessment was not possible, using high resolution SPOT imagery was carried out on a sample basis. Results are included in accompanying documentation. The vector data was buffered by 500m (radius) representing the zone of influence impacting boreal caribou herds in order to calculate range disturbance levels as well as for use in the integrated risk assessment analysis. Fire polygons were merged into the anthropogenic footprint in order to create an overall disturbance footprint.
-
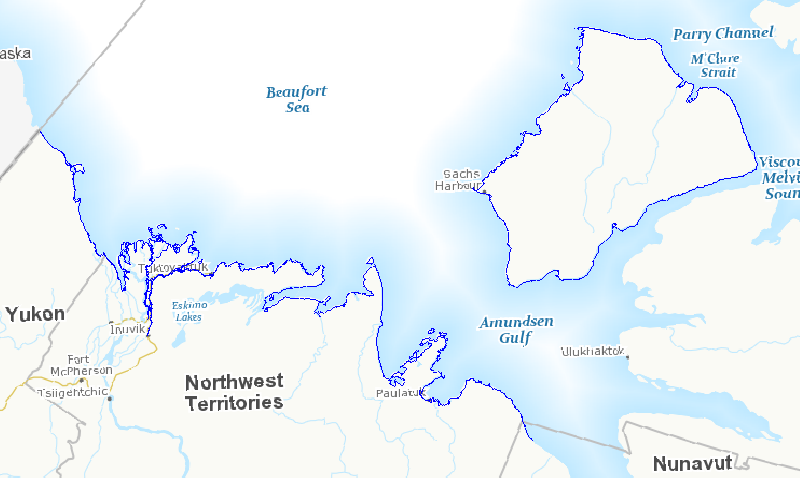
In the face of increasing economic opportunities in Canada's northern regions, the need to improve our state of preparedness for oil spill related emergencies in particular is critical. While significant efforts have been put towards documenting baseline coastal information across Canada’s southern regions, there is a large information gap regarding Arctic shorelines. Baseline coastal information such as shoreline form, substrate and vegetation type, is required for operational prioritization, coordination of on-site spill response activities (i.e., SCAT: Shoreline Cleanup and Assessment Technique), as well as providing valuable information for wildlife and ecosystem management. A standardized methodology was developed to map shoreline characteristics at six study sites across the Canadian Arctic: James Bay, Resolute Bay, Hudson Bay, Labrador Coast, Victoria Strait, and Beaufort Sea. Geo-referenced high definition videography was collected during the summers of 2010 to 2012 along coastlines within the study sites. Detailed information (i.e. shoreline type, substrate, form, height, slope, fetch, access type, exposure, etc.) describing the upper intertidal, supratidal, and backshore zones was extracted from the video and entered into a geospatial database using a data collection form. This information was used to delimit and map alongshore segments in the upper intertidal zone. The result is a vector dataset containing thousands of linear shoreline segments ranging in length from 200 m and 2 km long. In total, almost seven thousand kilometers of northern shorelines were mapped, including twenty five different shoreline types based on the upper intertidal zone. This information will feed into a larger ongoing project focused on Arctic coastal ecosystems as well as serve as valuable information for oil spill response planning should the need arise. This database also provides valuable information for habitat management, local shoreline planning, can feed into environmental assessments or be used to aid research site selection.
-
Waterfowl and mammals harvested and trapped at various locations in the oil sands region and in reference locations are assessed for contaminant burdens and toxicology. Wildlife samples are obtained from local hunters and trappers. Tissue samples are analysed for concentrations of oil sands-related contaminants (heavy metals, polycyclic aromatic hydrocarbons, and naphthenic acids). Dead and moribund birds collected from tailing ponds are also evaluated for levels and effects of contaminants.
-
Communities in east Hudson Bay and James Bay are concerned about ecosystem changes observed in recent decades, particularly related to sea-ice conditions, and also about potential impacts of contaminants from long-range atmospheric transport and regional human activities. The Arctic Eider Society’s Community-Driven Research Network (CDRN) was established to measure and better understand large-scale cumulative environmental impacts in east Hudson Bay and James Bay. Building on CDRN collaborations and activities in five communities (Sanikiluaq, Kuujjuaraapik, Inukjuak, Umiujaq, Chisasibi), this Northern Contaminants Program (NCP) community-based project generated new information on metal bioaccumulation that provide a regionally integrated perspective on metal exposure in the marine environment of east Hudson Bay and James Bay.
-
There is increased exploration for and extraction of lanthanides or Rare Earth Elements (REEs) due to their increasing use and importance, especially in new technologies. In Canada, several exploration projects are underway and some projects could seek approval to begin operation in the next few years. In addition, REEs are associated with phosphate fertilizers used in Canada. There is little information on the toxicity of REEs and their presence in the environment and wildlife. We are conducting REE analyses to determine the exposure of wildlife to REEs in different regions.
-
Pesticide use is a pervasive element of conventional farming that poses risks to non-target organisms in fields and field margins. A critical component of plant and pollinator habitat in agroecosystems is adequate pollen supplies (quality and quantity) both for plant reproduction and animals dependent on pollen for food. Honey bees have shown preference for pollen with certain amounts of amino acids. Glyphosate is a systemic herbicide not readily metabolized by plants. It acts by inhibiting three amino acids, phenylalanine, tyrosine and tryptophan. We hypothesized that sublethal doses of glyphosate (simulating drift) will affect flower, pollen and seed production and quality.
-
Unlike their “first-generation” counterparts, second-generation anticoagulant rodenticides (SGARs; for instance, bromodiolone) are more persistent, bioaccumulative and inherently toxic. An issue with this greater toxicity and persistence is that it increases their potential to impact non-target wildlife. With increasing natural resource extraction activities in northern Alberta, facilities capable of housing thousands of workers are needed, and each of these produce waste and attract rodent pests. Many companies now regularly deploy SGAR baits in a prophylactic manner. With this increased use, there is a resulting increased probability of exposure to rodenticide baits in non-target wildlife inhabiting areas of higher industrial development.
-
In this study we will conduct laboratory and mesocosm exposures with wood frogs (Lithobates sylvaticus) and, possibly, surrogate amphibian species to assess potential environmental impacts stemming from industrial development in the Oil Sands. Toxicogenomics and other exposure and effects endpoint data generated will be added to other data being collected on wood frogs in the Oil Sands region and incorporated into the Adverse Outcome Pathway model to provide a consolidated assessment of potential Oil Sands environmental impacts based on the health and disease status of wood frogs and wood frog populations.
-
This study is identifying risks, impacts, origins, and movement patterns of migratory bird pathogens in the Western Hemisphere. We are identifying determinants of disease to multiple pathogens in relation to demographic, spatiotemporal, and environmental factors using blue-winged teal sampled in North and South America. We are combining use of disease surveillance data, modeling of band recovery data, analysis of feather stable isotopes, use of satellite telemetry, and genotyping techniques to investigate origins and spread of diseases. This study will ultimately enable development of models predicting emergence and spread of diseases in migratory bird populations, and where they may enter into Canada.